Andrew Martin
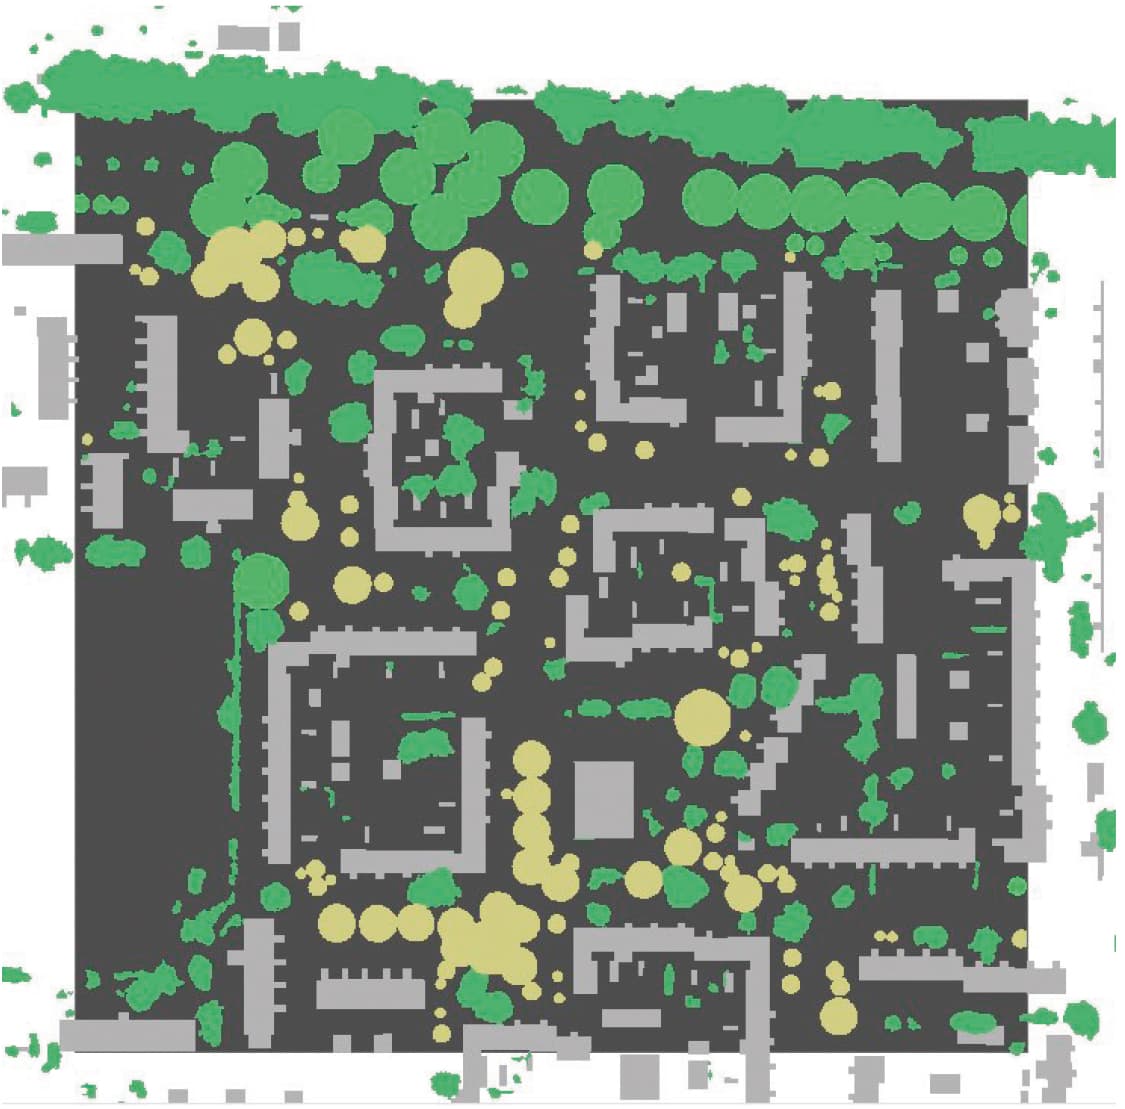
Figure 1: A sample grid square with council department trees and existing canopy cover.
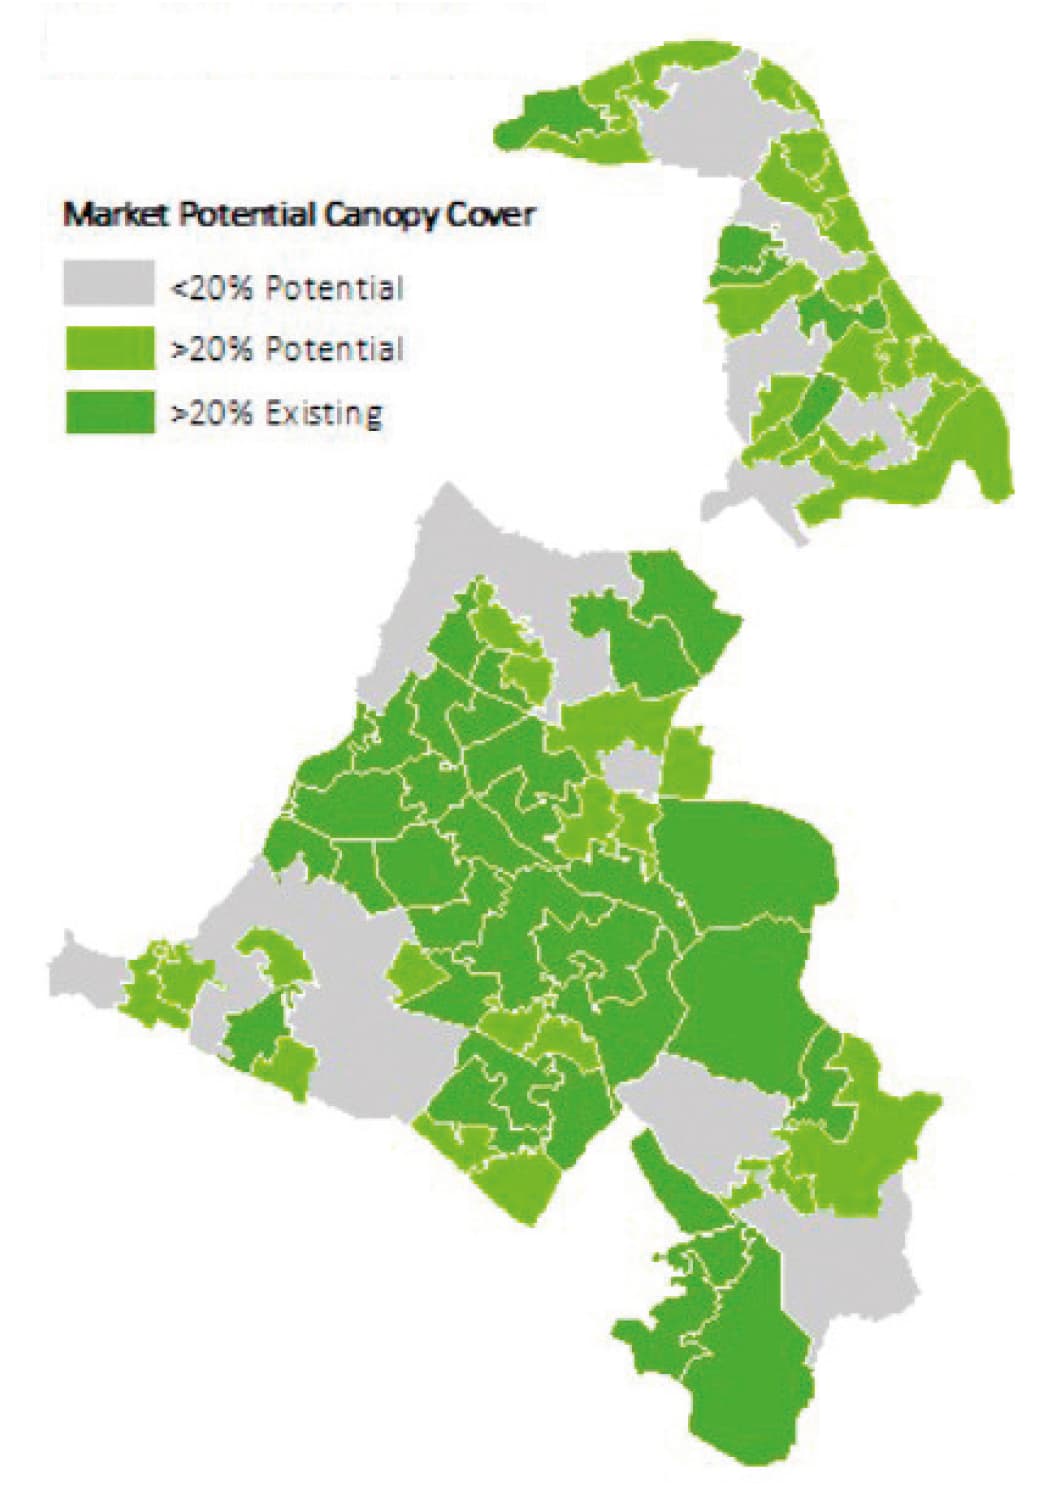
Figure 2: Sub-wards with existing canopy cover >20% and sub-wards’ potential canopy cover.
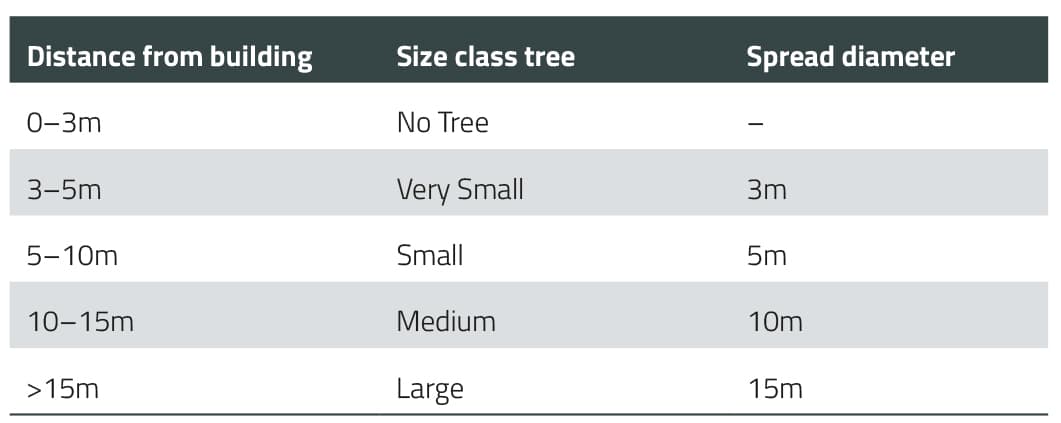
Table 1: Tree crown spreads assigned to council land based on distance form building.
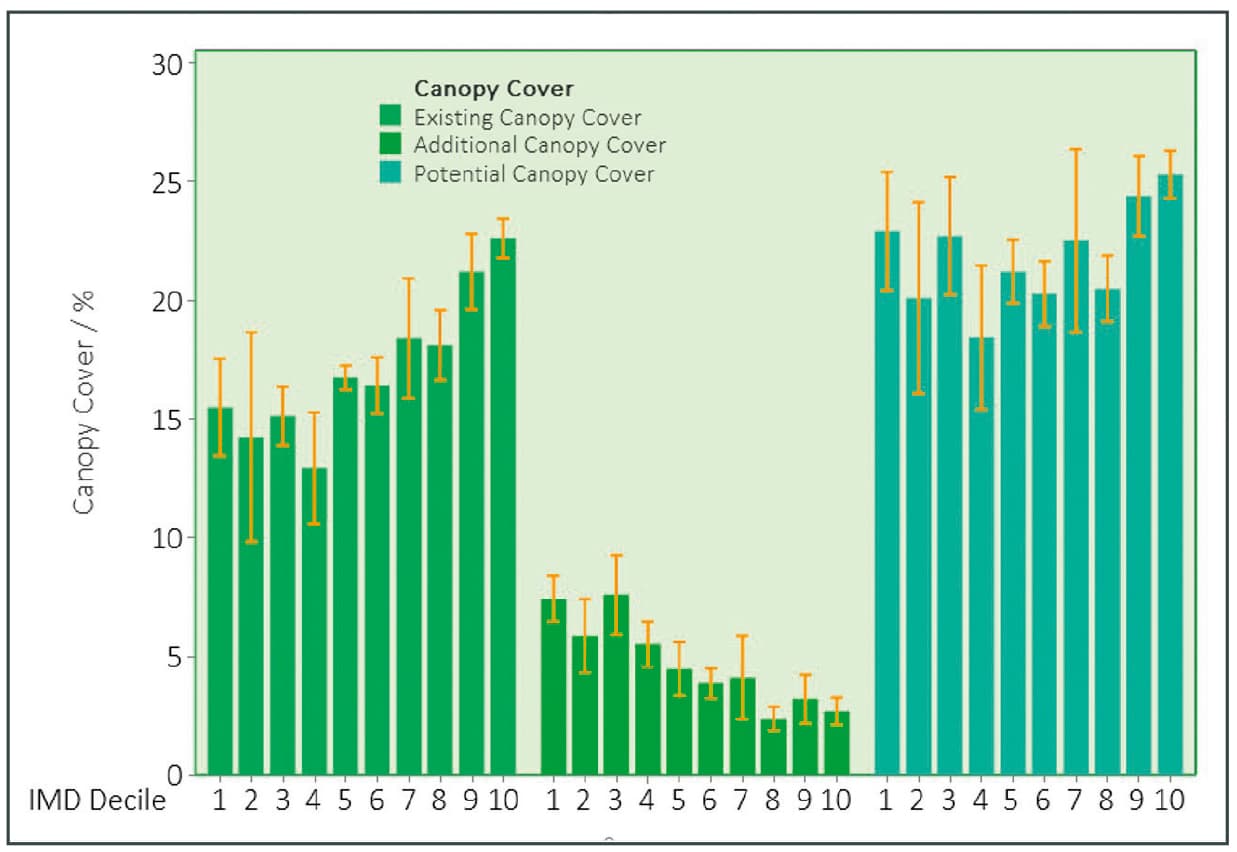
Figure 3: Indices of deprivation had significant relationships with existing canopy cover (p = <0.001, DF = 1, R-sq = 14.99%) and additional canopy cover but not with potential canopy cover (p = 0.308, DF = 1, R-sq = 0.91%).
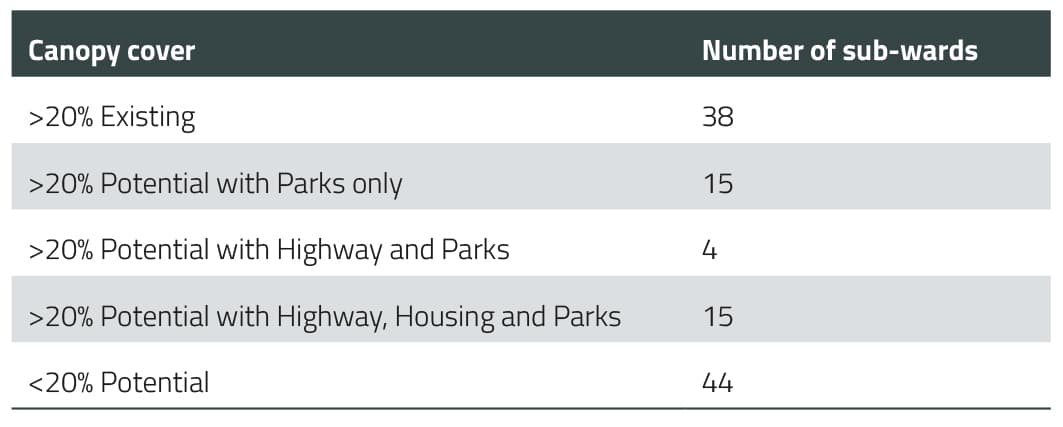
Table 2: Canopy cover potential and number of sub-wards in each bracket.
Stepping into the world of GIS in early 2020 was the beginning of something that I am unlikely to ever put down.
With some guidance from a colleague, the internet and plenty of trial and repeat, I was hooked like a kid to Minecraft. What would make more sense after this than to jump in with two feet and choose this as a foundation for a BSc dissertation project?
Simultaneously to my entrapment by ArcMap, the content of my BSc course increased my awareness of the importance of trees in providing ecosystem services for urban areas. Colleagues and I were also experiencing the increasing pressure on councils to plant more trees and noticed the emerging trend of local authorities creating tree planting strategies to meet these pressures. I began to realise that my new found enthusiasm for GIS could be a way for the local authority to achieve a better urban forest for the future. Using GIS, I was able to calculate the canopy cover that could be achieved from available planting locations, with the hope of providing guidance on where trees could be planted more effectively in order to maximise canopy cover and the services that they provide.
Project background
Despite greater knowledge of beneficial ecosystem services and added political pressure to plant more trees to increase canopy cover, a number of different factors have led to a decline in urban canopy cover. As a result, councils have started to set minimum targets of 20% canopy cover in urban areas. Canopy cover relates to land type and therefore local authorities need to make sure canopy targets are both aspirational and achievable for their area before committing to them.
As a starting point, a GIS layer that contains all pervious surfaces may be used to estimate potential canopy cover. However, setting canopy cover targets based on all land availability does not necessarily reflect current common tree planting practices. Whilst most local authority strategies include tree planting as a method of increasing canopy cover, this most commonly takes place on publicly owned space. Neglecting the use of private land that can make up 60–70% of the land area creates a barrier to significant canopy cover potential, can cause an unequal canopy distribution, and therefore may not provide a canopy that meets all the needs of all the borough’s inhabitants.
Method
GIS datasets* were manipulated in ArcMap 10.4 to calculate canopy cover percentages and identify the council-owned permeable space available for planting that was not already occupied by canopy.
Technical canopy potentialM/h4>
Additional trees were plotted on all the available council-owned land using the software and the appropriate canopy size for the space was determined based on the distance of the land parcels from buildings (Table 1). The new canopy cover generated from the plotted trees was added to the existing canopy cover and used to calculate the technical canopy potential for each sub-ward.
Actual canopy potential
80 Land Classification 250m × 250m grids were randomly selected and sampled. The trees plotted on the desktop were accepted or rejected based on the presence of physical obstructions to tree planting such as utility infrastructure, insufficient ground space and street lighting. Tree locations that had not been identified on the desktop were also plotted. The difference between the technical canopy cover and the accepted canopy cover was used to calculate the actual potential canopy cover for each sub-ward (Figure 1).
Results
The highlights of the results were:
- A borough-wide average of greater than 20% canopy cover potential is achievable using publicly owned space.
- Almost a third of sub-wards had less than 20% canopy cover potential, showing the need to use privately owned land in these areas if a 20% target is to be achieved.
- Additional public canopy potential was not sufficient in sub-wards with high coverage of medium-density settlement and low coverage of low-density settlement, showing the need to seriously consider other strategies for promoting canopy increase.
- Participation from multiple council departments (Parks, Highways and Housing) is essential to achieve maximum canopy cover, especially in more deprived areas.
- The amount of space does not contribute to the low canopy cover in more deprived areas, showing that land available for tree planting is not being used.
Potential canopy cover
Planting potential on council-owned land was found to be sufficient to increase average urban area canopy cover to 22%. This was 3.75% above the existing canopy, and exceeded the recommended minimum of 20%.
30% of the sub-wards had an existing canopy cover of >20%, and an additional 35% of sub-wards could achieve >20% with canopy originating from council-owned land. Relying on canopy from council-owned land meant that 35% of sub-wards were unable to achieve >20% potential canopy cover, showing that the distribution of the average 22% canopy was geographically uneven (Figure 2).
Therefore, to attain 20% canopy cover in all sub-wards, strategies that engage private landowners may be required. This could also be combined with modification of the public land infrastructure by utilising structural soils to provide better street tree planting environments.
Department contribution and canopy cover
Throughout the study, the amount of canopy cover was strongly influenced by how much originated for recreational and park land. The Parks Department also accounted for a large proportion of the potential additional canopy cover, but 50% of the sub-wards that had a >20% potential relied on canopy cover derived from two other departments (Table 2). This confirmed that it is essential for all council departments to contribute and adopt strategies to increase canopy cover through tree planting.
Indices of deprivation and potential canopy cover
The study confirmed that the commonly reported trend of lower canopy cover in more deprived sub-wards was true for Solihull’s urban area. However, in areas of higher deprivation, there is the potential for more additional canopy cover to be generated. This reflected the amount of public land present but also showed that more deprived areas were under-planted. This resulted in the surprising result that deprivation did not have an effect on the potential canopy cover of the sub-wards (Figure 3).
The analysis suggested that the cause of the existing negative correlation between deprivation and canopy cover is not necessarily lack of physical space. It may be due to complex social relations with trees and the Housing Department’s economic constraints.
Land classification and potential canopy cover
The land classes that the sub-wards were made up of had a relationship to the existing canopy cover and the canopy potential.
25% of sub-wards with an existing canopy cover of >20% had below-average levels of high- and medium-density settlement. 30% of sub-wards with a potential for <20% canopy cover had below-average low-density settlement and recreational land, and 25% had above-average medium-density settlement.
Sub-wards with above-average medium-density settlement were characterised by lower existing canopy cover, less publicly owned space, and more obstructions to new tree locations. Therefore, in these areas alternative strategies to increase canopy cover need to be utilised.
Conclusion
The study identified trends that may be found if council-owned land is used to its full potential. It showed that if local authorities are to achieve an evenly distributed canopy cover above the recommended minimum, internal and external collaboration is required.
Whilst the information from the project has been useful, it should be viewed as basis for future studies to build on. It is acknowledged that to achieve maximum canopy cover potential there are other factors that affect final canopy size and the scope of this project does not consider the rate at which it is achieved. It is fairly safe to say that local authorities do need to improve planting practice, improve post-planting maintenance and invest in infrastructure so that trees can successfully be accommodated in urban areas. This project largely looked at available space but there are also plenty of other social and environmental factors that can be used to inform planting strategies at the borough level.
Footnotes:
* GIS datasets used: National Tree Map (Blue Sky Int.), Office for National Statistics Land Classification 250m × 250m Grids and Solihull Metropolitan Borough Council Grounds Maintenance records.
Andy Martin is a 27-year-old Urban Forestry Officer for Solihull MBC who graduated with a 1st in Arboriculture and Urban Forestry from Myerscough College in July. Whilst his current role is varied, one of his passions is getting the right tree in the right place from the outset. Using his skills with GIS he hopes that he will be able to influence locations of both public and private planting projects across the borough.
This article was taken from Issue 194 Autumn 2021 of the ARB Magazine, which is available to view free to members by simply logging in to the website and viewing your profile area.